Adding Statistics to the blog
Previous entry Building this blog
Soo, originally I only wanted to improve the styling of code blocks and add syntax highlighting - I realized I put a bunch of screenshots instead of code blocks in my blog posts, mostly due to the code blocks looking so bad previously. Well, let's just say I got side tracked....
The code block styling itself was just a quick CSS change, the syntax highlighting is done using
prism.js, nothing to write a blog post about. I also adjusted the general color scheme of the blog to match my Emacs theme. However, opening the blog project again reminded me of the things I still wanted to add, mainly statistics and comments.Back then, I only thought about adding something like Google Analytics to the site and call it a day. But I don't really want to give Google a way of tracking users on my site, and a big tracking framework would also be complete overkill for what I need.
So this led me to building my own statistics framework, I started out building a simple backend in PHP using sqlite3 as a database, for saving timestamps. Timestamps are collected by a JS script that is run when the page gets opened.
The backend then only provided a visitor count and a visitor count over the last 30 days, which I can then show as a nice little counter on any blog entry. But just a counter is boring, why not track some cooler data and display it in a nicer way? This is where the side tracking really started...
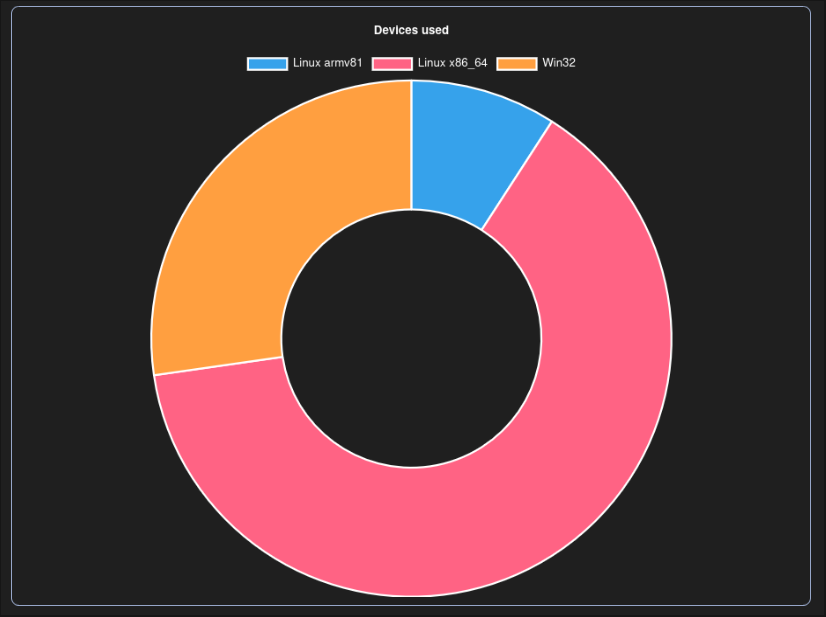
Chart showing the devices used to visit the site (though these accesses were all me)
Using
chart.js and some quick changes to the backend, I was able to display both a graph of the visits of the last 30 days and a pie chart of devices used to access my site. Even though I really dislike the JS ecosystem (sourcing dependencies from other CDNs seems insane to me tbh...) I must say this was overall a good experience and got the job done quickly. I experimented with a quick graph renderer in an HTML canvas, but this path would have led me to developing a whole own chart framework, which I really didn't plan on doing....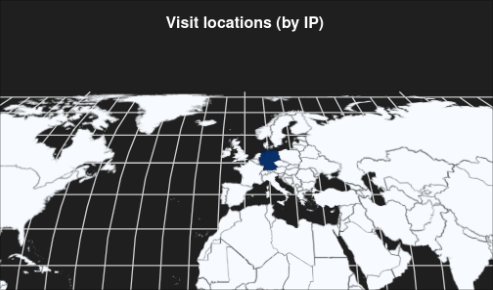
Excerpt of the map view, just showing my visits, so they are all in Germany
When checking out
chart.js I also came across this cool looking geo charts plugin which inspired me to add country tracking as well. This isn't as easy as just getting the current time or device of the user, the country is determined by the IP of the client (this is also done client-side only, so no IP addresses get saved or even sent to my server). The API I am using to determine the country from the IP address is rate limited, so not all countries will get tracked (at least on days with lots of traffic), so I might need to find an alternative, but for now it's fine.This was another project where I did the backend in PHP, to be honest I am not a big fan of PHP, I think a proper backend needs a language with better static analysis than just an interpreter with an optional linter...
However, you can't beat the ease of use with PHP for a small backend like this, you just put your PHP script into your web server's folder, and you are good to go.
Same thing goes with using SQLite over something like MySQL for the database, it's easy to use, gets the job done and I like having everything contained in a single DB file.
In the end, this was just a 2.5 day project, but I think it turned out quite well, and I am really looking forward to seeing the statistics develop over the coming days and weeks.
As always, all the code is open source, with the blog here and the statistics backend here
You can find the blog's statistics here, if you haven't already :)